Turning muscle activity into music
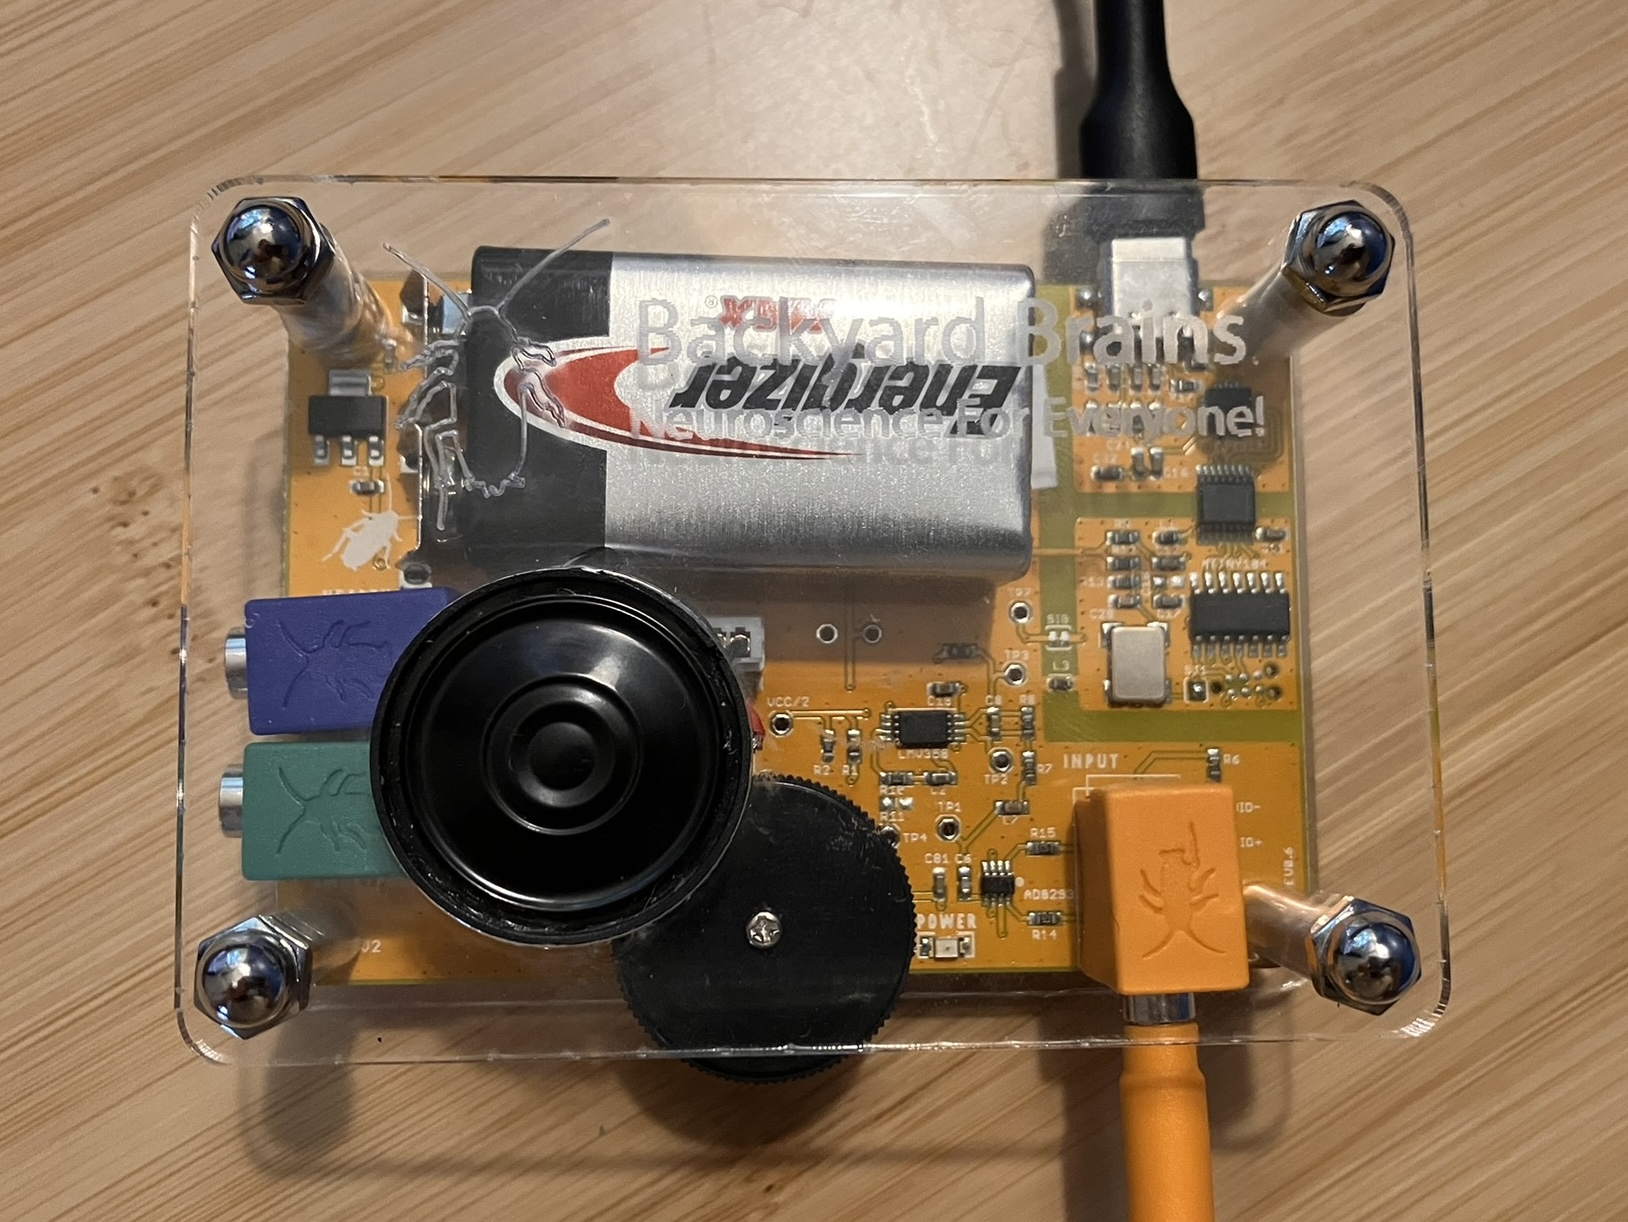
For the past couple years, a few friends and I have been running a neuroscience station at Dartmouth’s Science Day. One of our main activities involves recording muscle activity using electromyography (EMG) and transforming those signals into simple musical tones. The idea started when I came across Backyard Brains, a company that makes creative and accessible neuroscience kits for outreach. One of their tools, the NeuroSpiker box, uses Arduino microcontrollers to detect EMG signals, which it visualizes in an app and represents with a crackling sound that intensifies with stronger muscle flexes. Around this time, I had begun working on a research project exploring how music might help modulate brain activity in epilepsy. That made me wonder whether the reverse could be interesting to play with: could we use our body’s electrical signals to generate music?
Together with Elis Jackson, we started building the first version of our app. At this stage, “app” was a generous term — it was a couple of Python scripts without any user interface. It read raw binary data from the USB port and decoded it into a raw EMG signal, reflecting the electrical activity generated by groups of muscle fibres. We filtered out line noise and focused on frequencies typical of muscle activity. Every 0.2 seconds, we calculated the dominant frequency via Fourier transform, then mapped each participant’s frequency range to two octaves of musical tones. Though not without its flaws, the setup worked well enough to engage visitors of all ages — with parents often getting the most involved, trying to coax out something that resembled music.
This year, we revisited our original assumption that EMG signal frequency could be used to estimate the strength of muscle flexion. After digging into the literature, we learned that while frequency may increase with force at low levels of muscle engagement, the relationship quickly plateaus — which helped explain the inconsistent results we had seen during the event. We decided to shift to using the amplitude of the EMG signal instead, which more reliably reflects the level of motor unit activation. Elis developed a beautiful Dash app that displays the raw EMG signal alongside frequency and amplitude graphs. It made the underlying signal easier to explain — and more fun to engage with. For more details on this: Elis wrote up the technical side here.
This year we also broadened the neuroscience station this year by collaborating with other PhD students. Visitors could explore neuroanatomy with real human and sheep brains, thanks to friends who regularly perform brain surgeries on mice. Another friend working on peripheral nerve regeneration with zebrafish explained how muscles function, while an fMRI PhD student prepared a primer on signal processing.
This year, we expanded the station through collaboration with other PhD students. Visitors could explore neuroanatomy with real human and sheep brains, learn about the neural pathways that carry motor signals from brain to muscle, and get an introduction to signal processing concepts like frequencies. Bringing these activities together made the station a vibrant hub during Science Day. The genuine engagement from everyone made the experience truly rewarding.